agora <-function() { x <-format(Sys.time(), "%Y-%m-%d %H%M%S")return(x)}parse_svg <-function(x) {# Function that parses svg files into text. svg_string <-paste(readLines(x),collapse ="\n" )return(svg_string)}
Rows: 31 Columns: 4
── Column specification ────────────────────────────────────────────────────────
Delimiter: ","
chr (1): Company
dbl (3): Total Contributed, # of Politicians Contributed to, # of States Whe...

ℹ Use `spec()` to retrieve the full column specification for this data.
ℹ Specify the column types or set `show_col_types = FALSE` to quiet this message.
Rows: 117 Columns: 4
── Column specification ────────────────────────────────────────────────────────
Delimiter: ","
chr (1): Company
dbl (3): Total Contributed, # of Politicians Contributed to, # of States Whe...

ℹ Use `spec()` to retrieve the full column specification for this data.
ℹ Specify the column types or set `show_col_types = FALSE` to quiet this message.
Rows: 126 Columns: 6
── Column specification ────────────────────────────────────────────────────────
Delimiter: ","
chr (1): Company
dbl (3): Amount Contributed Across States, # of Politicians Contributed to, ...
lgl (2): Pride?, HRC Business Pledge

ℹ Use `spec()` to retrieve the full column specification for this data.
ℹ Specify the column types or set `show_col_types = FALSE` to quiet this message.
Rows: 364 Columns: 6
── Column specification ────────────────────────────────────────────────────────
Delimiter: ","
chr (5): Company, Pride Event Sponsored, Sponsorship Amount, where available...
dbl (1): Year

ℹ Use `spec()` to retrieve the full column specification for this data.
ℹ Specify the column types or set `show_col_types = FALSE` to quiet this message.
Rows: 103 Columns: 4
── Column specification ────────────────────────────────────────────────────────
Delimiter: ","
chr (3): Politician, Title, State
dbl (1): SUM of Amount

ℹ Use `spec()` to retrieve the full column specification for this data.
ℹ Specify the column types or set `show_col_types = FALSE` to quiet this message.
Rows: 5497 Columns: 5
── Column specification ────────────────────────────────────────────────────────
Delimiter: ","
chr (4): Donor Name, "True" Donor - Pride Sponsor Match Only, Pride and Spon...
lgl (1): "True" Donor - Fortune Match Only

ℹ Use `spec()` to retrieve the full column specification for this data.
ℹ Specify the column types or set `show_col_types = FALSE` to quiet this message.
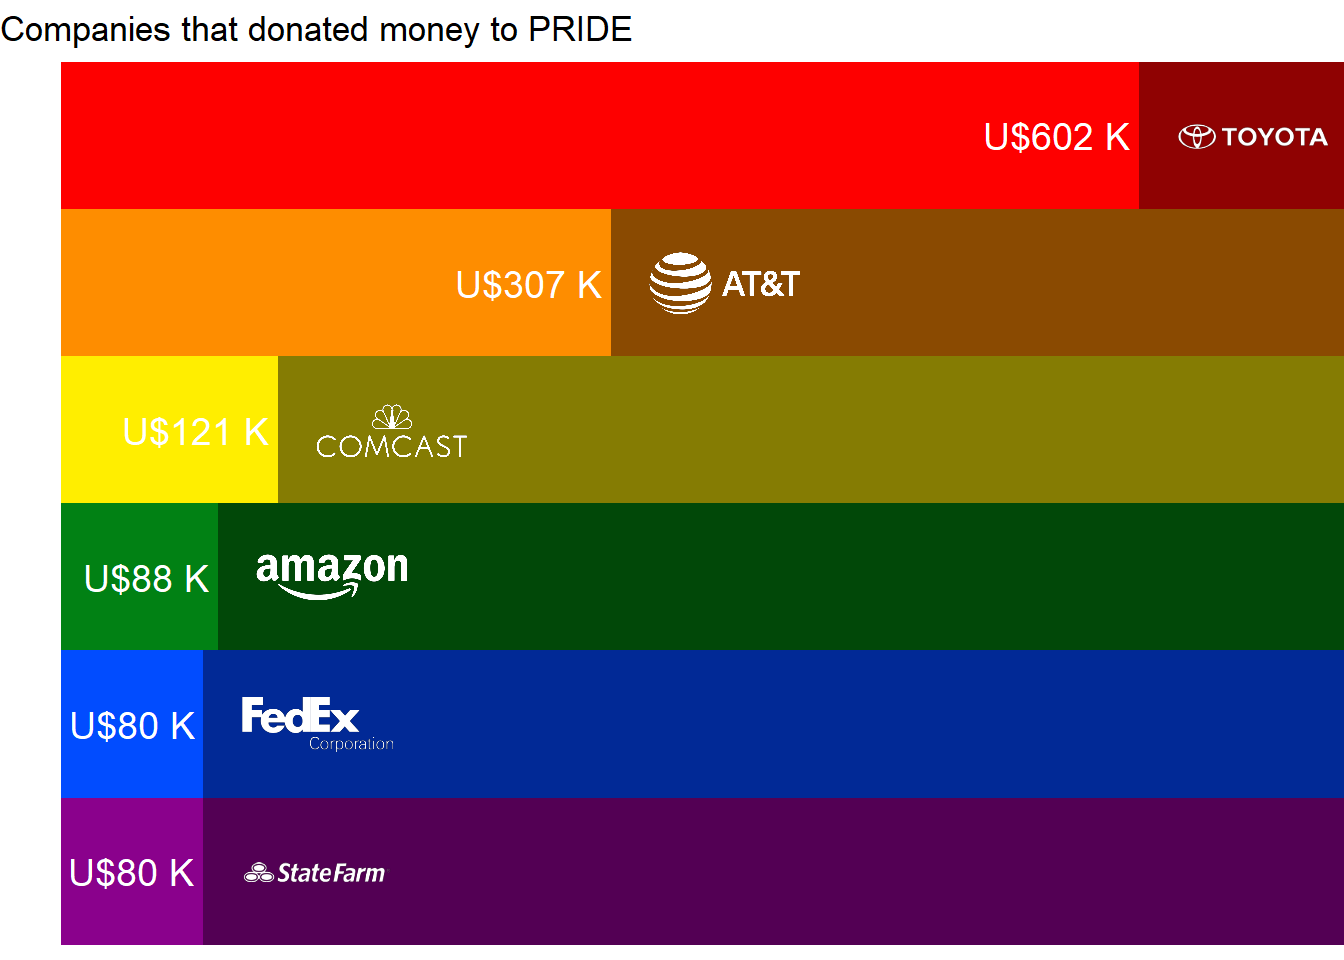
Analysis
saturated_palette <-c("#fe0000","#fe8d00","#ffee00","#018114","#014cff","#8a018c")desaturated <-darken(saturated_palette, amount = .45)path <- here::here('projetos','tidytuesday','2022','2022-Week_23')# List svg files from the directorypath_logos <-dir(path,pattern ="*.svg",full.names =TRUE,)# Create an object that contains the svg text of the logosimage_logos <-map(path_logos, parse_svg)# Company names in the correct order for later matchingcompany_names <-c("Amazon", "AT&T", "Comcast", "FedEx", "State Farm", "Toyota")# Set names for the logosnames(image_logos) <- company_names# Create a dataframe with the informationlogos_df <-bind_rows(image_logos) %>%pivot_longer(1:6) %>%rename("company"= name)