Loading required package: timechange

Attaching package: 'lubridate'

The following objects are masked from 'package:base':

    date, intersect, setdiff, union
Data
temperature <- readr::read_csv("https://raw.githubusercontent.com/rfordatascience/tidytuesday/master/data/2020/2020-01-07/temperature.csv" )
Rows: 528278 Columns: 5
── Column specification ────────────────────────────────────────────────────────
Delimiter: ","
chr  (3): city_name, temp_type, site_name
dbl  (1): temperature
date (1): date

ℹ Use `spec()` to retrieve the full column specification for this data.
ℹ Specify the column types or set `show_col_types = FALSE` to quiet this message.
Wrangle
city_temp <- temperature %>%filter( city_name %in%c("MELBOURNE", "PERTH", "SYDNEY", "BRISBANE"), date >=as_date("1970-01-01"), date <as_date("2019-01-01") ) %>%group_by(city_name,year =year(date),month =month(date, label =TRUE) ) %>%summarise(temp =mean(temperature, na.rm =TRUE))
`summarise()` has grouped output by 'city_name', 'year'. You can override using
the `.groups` argument.
Plot
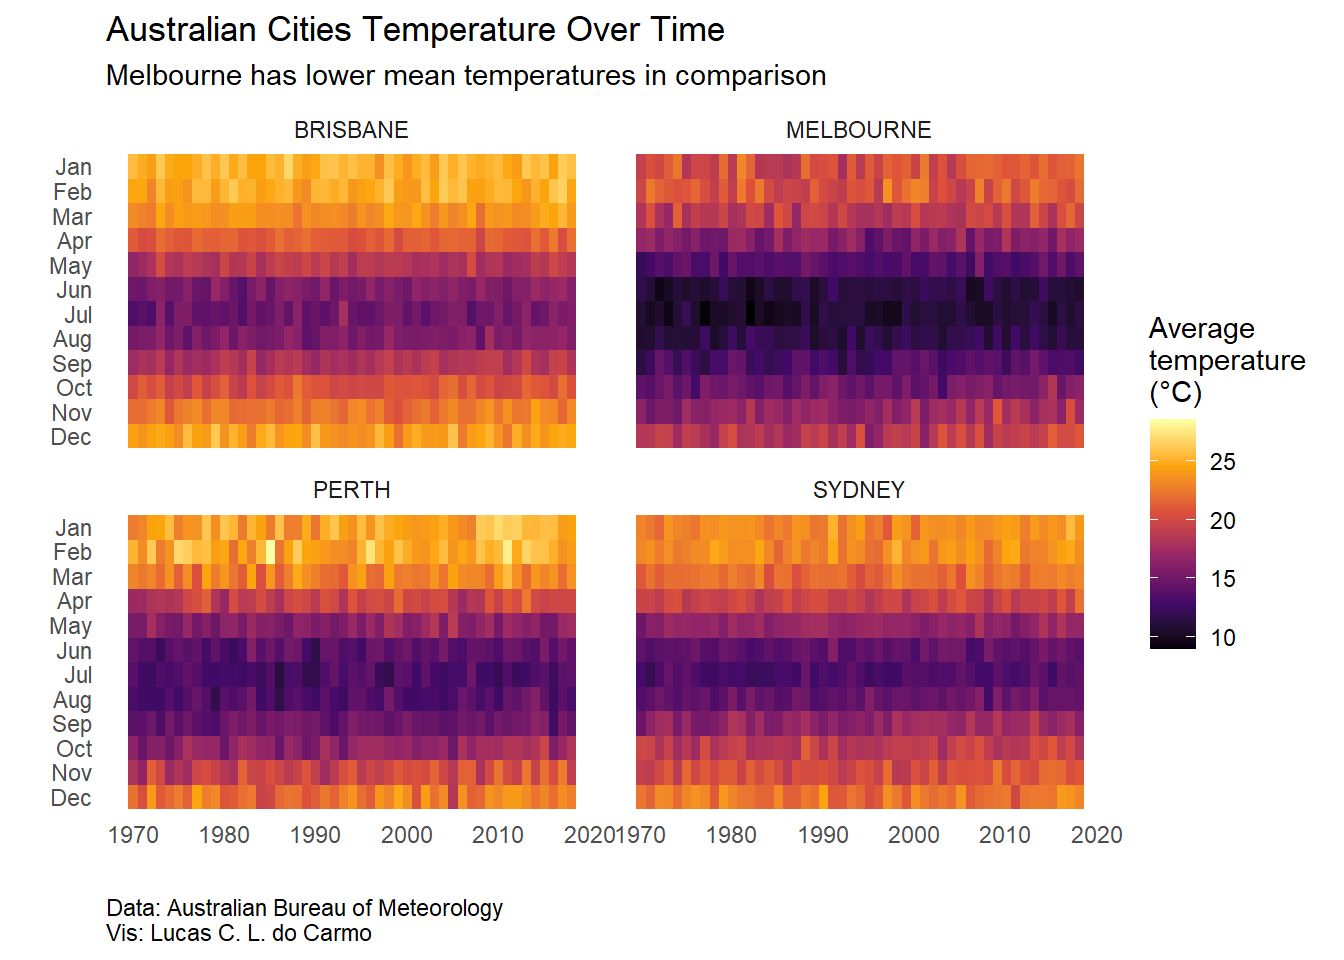
ggplot(city_temp, aes(x = year,y = forcats::fct_rev(month),fill = temp )) +geom_raster() +scale_fill_viridis_c(option ="inferno") +theme_minimal() +theme(text =element_text(family ="Fira Sans"),panel.grid =element_blank(),plot.caption =element_text(hjust =0) ) +facet_wrap(~city_name) +labs(title ="Australian Cities Temperature Over Time",subtitle ="Melbourne has lower mean temperatures in comparison",y ="",x ="",fill ="Average \ntemperature \n(°C)",caption ="Data: Australian Bureau of Meteorology\nVis: Lucas C. L. do Carmo" )